
Gaia finds new alerts every day - but what happens next? Gaia tells us there is something exciting happening but the satellite has a very set schedule of when it monitors the sky so we can not use Gaia to take more images of the new discovery.
Instead we can use telescopes around the world to take images over time to see how the object changes. Plotting the brightness of an object with time is called a light curve. Different astronomical transient objects change very differently with time. Transient objects are ones which appear suddenly and then disappear again after some time. We can investigate the change in brightness with time to learn about the objects. We can try to answer questions such as; what they are and are they doing something very special.
Supernovae, explosions of stars at the end of their lives, are one of the transients we are most interested in. They get brighter by about 3 magnitudes (which is about 15 times brighter) over days to weeks, and then fade away again over months. Taking images every few days from the ground allows us to really see the shape of the supernovae explosion. There are a few different types of supernovae explosions.
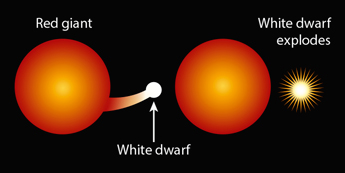
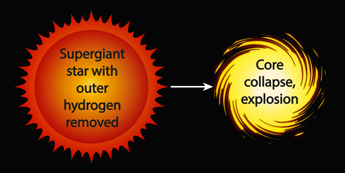
Supernovae. The image shows how type Ia (left) and core collapse (right) supernovae are formed. Image credit: Amanda Smith.
Type Ia supernovae, are all about the same brightness and so can be used to measure distances in the Universe. This allows us to investigate the mysterious dark energy that is pushing everything away from each other, faster and faster. However, Type Ia supernovae are not all quite the same brightness, measuring the light curve of these objects means we can make a correction based on the light curve and make them even better probes of the Universe.
Core Collapse supernovae are bright for a similar time to Type Ia supernovae. However, Core Collapse supernovae do not produce as much energy in the explosion so the light curve does not peak as high. Also, different elements are produced in the explosion, and the radioactive decay of some of the elements produced power the tail of the light curve, so the shape is different between Core Collapse and Type Ia supernovae.
Supernovae light curves. Light curves (brightness versus time) for various types of supernovae. The dashed black line shows the cutoff for classification as "super-luminous". Source: Avishay Gal-Yam (2012) "Luminous Supernovae", Science, vol. 337, no. 6097, pp. 927-932. DOI: 10.1126/science.1203601. [Online] Available from http://science.sciencemag.org/content/337/6097/927 (link is external). See also "Super-luminous Supernovae (link is external)" article on astrobites..
Some Gaia Science Alerts might only be bright for a few days, such as outbursts from binary stars (cataclysmic variables). This means that images need to be taken on a much quicker time scale, every few hours for a few nights, so that the shape of the outburst can be mapped. This will then enable astronomers to study what is happening in the stars and why the outburst occurred.
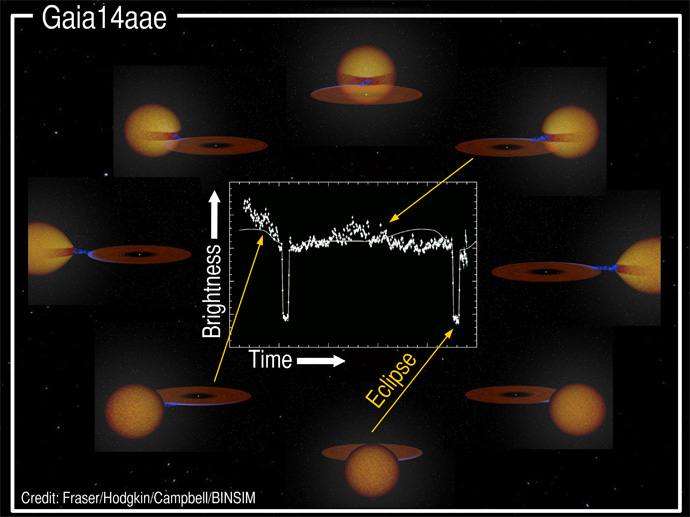
Light curve of Gaia14aae. The image shows how the light curve of Gaia14aae changes as the stars orbit each other. Credit: M. Fraser, S. Hodgkin and H. Campbell. BinSim software has been used to create the image.
If the binary system is eclipsing (one star passing directly between us and the other star) then we see a dip in brightness. If the two stars are close together then this ellipse might occur very often (every tens of minutes). So looking at this type of object with lots of short “follow-up” images back to back would detect the dip in brightness as one star eclipses the other. The amount the light dims depends on the luminosities of both stars, their separating and their inclination to us, meaning are we just seeing the edge of one star pass the others or are they completely covering each other.