
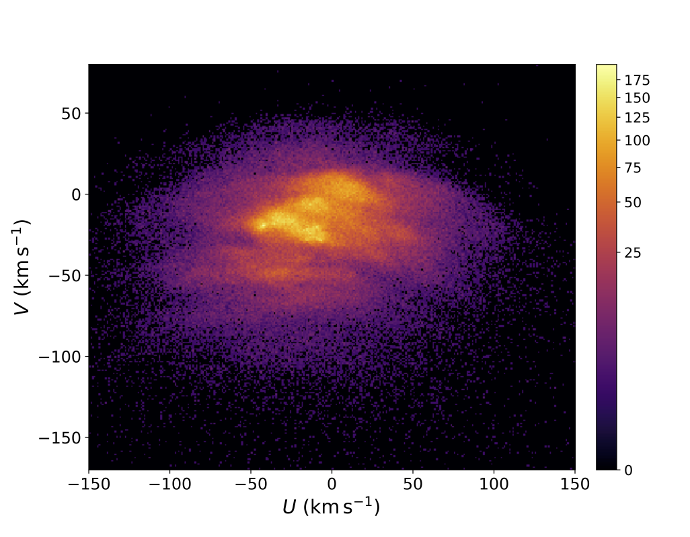
Gaia velocity distribution of stars in the Solar neighbourhood. The image shows the velocities of 366 182 stars closer than 200 pc. It is a 2D histogram of the Galactic radial velocity (horizontal axis) and the velocity in the direction of rotation (vertical axis), in the reference frame of the Sun's movement.
The velocities of stars in our Galaxy are an outstanding source of information about the current structure of our Galaxy but also about its past. This is because the stellar orbits tell us where the stars come from, and moreover, the orbits are determined by the gravitational potential of the Galaxy and its evolution. The Gaia DR2 astrometric measurements and radial velocities make the largest, most precise and most extended sample of stellar positions and kinematics (6D phase space coordinates) inofour Galaxy. This sample has been explored in the paper "Gaia Data Release 2: Mapping the Milky Way disk kinematics" by Gaia Collaboration et al. 2018, which is one of the science demonstration papers chosen by DPAC for a first test and validation of the Gaia DR2 data.
The image shows the velocities of the stars closer than 200 pc to the Sun, in what is called the Solar neighbourhood. This has been the region of the Galaxy better explored prior to Gaia, where perhaps no big changes were expected. Yet, the quality of the Gaia data is so magnificent that a new velocity plane is revealed. We observe that the distribution of stars is highly patterned, with stars organised in thin nearly horizontal arches never seen before. It is just as we have suddenly put proper glasses on, and we see this velocity distribution with much detail that we were not able to discern before. It is the impressively large number of stars in the Solar neighbourhood, which is one order of magnitude larger than for previous surveys, and the excellent precision of the velocities, well below 1 km/s, that makes this discovery possible. We also observe tiny over-densities as yellow small peaks corresponding to well known open clusters, such as the Hyades or Pleiades, that now appear to be highly resolved.
Read more about mapping the Milky Way disc kinematics.
Download larger image (PNG, 961 KB).
Credits: ESA/Gaia/DPAC, Teresa Antoja, David Katz and co-authors of the paper "Gaia Data Release 2: Mapping the Milky Way disk kinematics".
Page last updated: 30 May 2018