
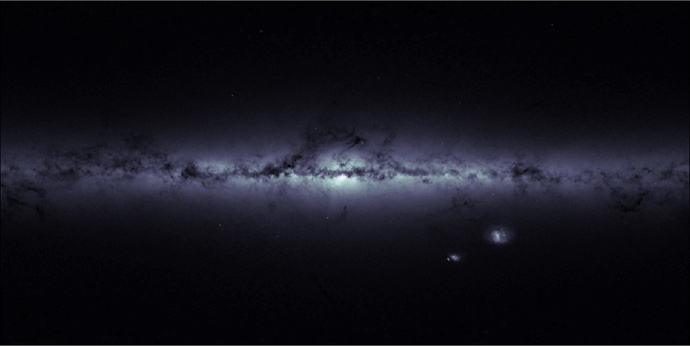
Gaia's stellar density map. Read more about Gaia's stellar density map. Credit: ESA/Gaia – CC BY-SA 3.0 IGO.
Last Friday, 21 August, ESA’s billion-star surveyor, Gaia, completed its first year of science observations in its main survey mode.
After launch on 19 December 2013 and a six-month long in-orbit commissioning period, the satellite started routine scientific operations on 25 July 2014. Located at the Lagrange point L2, 1.5 million km from Earth, Gaia surveys stars and many other astronomical objects as it spins, observing circular swathes of the sky. By repeatedly measuring the positions of the stars with extraordinary accuracy, Gaia can tease out their distances and motions through the Milky Way galaxy.
For the first 28 days, Gaia operated in a special scanning mode that sampled great circles on the sky, but always including the ecliptic poles. This meant that the satellite observed the stars in those regions many times, providing an invaluable database for Gaia’s initial calibration.
At the end of that phase, on 21 August, Gaia commenced its main survey operation, employing a scanning law designed to achieve the best possible coverage of the whole sky.
Since the start of its routine phase, the satellite recorded 272 billion positional or astrometric measurements 54.4 billion brightness or photometric data points, and 5.4 billion spectra.
The Gaia team have spent a busy year processing and analysing these data, en route towards the development of Gaia’s main scientific products, consisting of enormous public catalogues of the positions, distances, motions and other properties of more than a billion stars. Because of the immense volumes of data and their complex nature, this requires a huge effort from expert scientists and software developers distributed across Europe, combined in Gaia’s Data Processing and Analysis Consortium (DPAC).
"The past twelve months have been very intense, but we are getting to grips with the data, and are looking forward to the next four years of nominal operations," says Timo Prusti, Gaia project scientist at ESA.
"We are just a year away from Gaia's first scheduled data release, an intermediate catalogue planned for the summer of 2016. With the first year of data in our hands, we are now halfway to this milestone, and we’re able to present a few preliminary snapshots to show that the spacecraft is working well and that the data processing is on the right track."
As one example of the ongoing validation, the Gaia team has been able to measure the parallax for an initial sample of two million stars.
Parallax is the apparent motion of a star against a distant background observed over the period of a year and resulting from the Earth's real motion around the Sun; this is also observed by Gaia as it orbits the Sun alongside Earth. But parallax is not the only movement seen by Gaia: the stars are also really moving through space, which is called proper motion.
Gaia has made an average of roughly 14 measurements of each star on the sky thus far, but this is generally not enough to disentangle the parallax and proper motions.
To overcome this, the scientists have combined Gaia data with positions extracted from the Tycho-2 catalogue, based on data taken between 1989 and 1993 by Gaia's predecessor, the Hipparcos satellite.
This restricts the sample to just two million out of the more than one billion that Gaia has observed so far, but yields some useful early insights into the quality of its data.
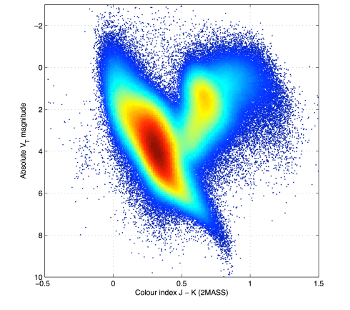
Gaia's first Hertzsprung-Russell diagram. Read about Gaia's first Hertzsprung-Russell diagram. Credit: ESA/Gaia/DPAC/IDT/FL/DPCE/AGIS.
The nearer a star is to the Sun, the larger its parallax, and thus the parallax measured for a star can be used to determine its distance. In turn, the distance can be used to convert the apparent brightness of the star into its true brightness or 'absolute luminosity'.
Astronomers plot the absolute luminosities of stars against their temperatures – which are estimated from the stars' colours – to generate a 'Hertzsprung-Russell diagram', named for the two early 20th century scientists who recognised that such a diagram could be used as a tool to understand stellar evolution.
"Our first Hertzsprung-Russell diagram, with absolute luminosities based on Gaia’s first year and the Tycho-2 catalogue, and colour information from ground-based observations, gives us a taste of what the mission will deliver in the coming years," says Lennart Lindegren, professor at the University of Lund and one of the original proposers of the Gaia mission.
Other examples of Gaia's achievements include:
- By detecting changes in brightness of observed stars Gaia has discovered hundreds of transient objects and variable stars.
- Detailed observations of Cat's Eye Nebula, that accurately trace out the intricate gaseous filaments that planetary nebulae are famous for.
- Detection of a large number of asteroids.
- Collection of spectra for a large number of stars. The basic use of these data is to determine the motions of the stars along the line-of-sight by measuring slight shifts in the positions of absorption lines in their spectra due to the Doppler shift. But in the spectra of some hot stars, Gaia has also seen absorption lines from gas in foreground interstellar material, which will allow the scientists to measure its distribution.
Read the full press release.
Page last updated: 05 July 2021