
To demonstrate the improvement made in the Gaia catalogue, some examples are given below which clearly highlight the quality improvement of the data.
From Hipparcos to Gaia DR1 to DR2 to EDR3 - the improvement on the astrometry of Cepheids and RR Lyrae stars
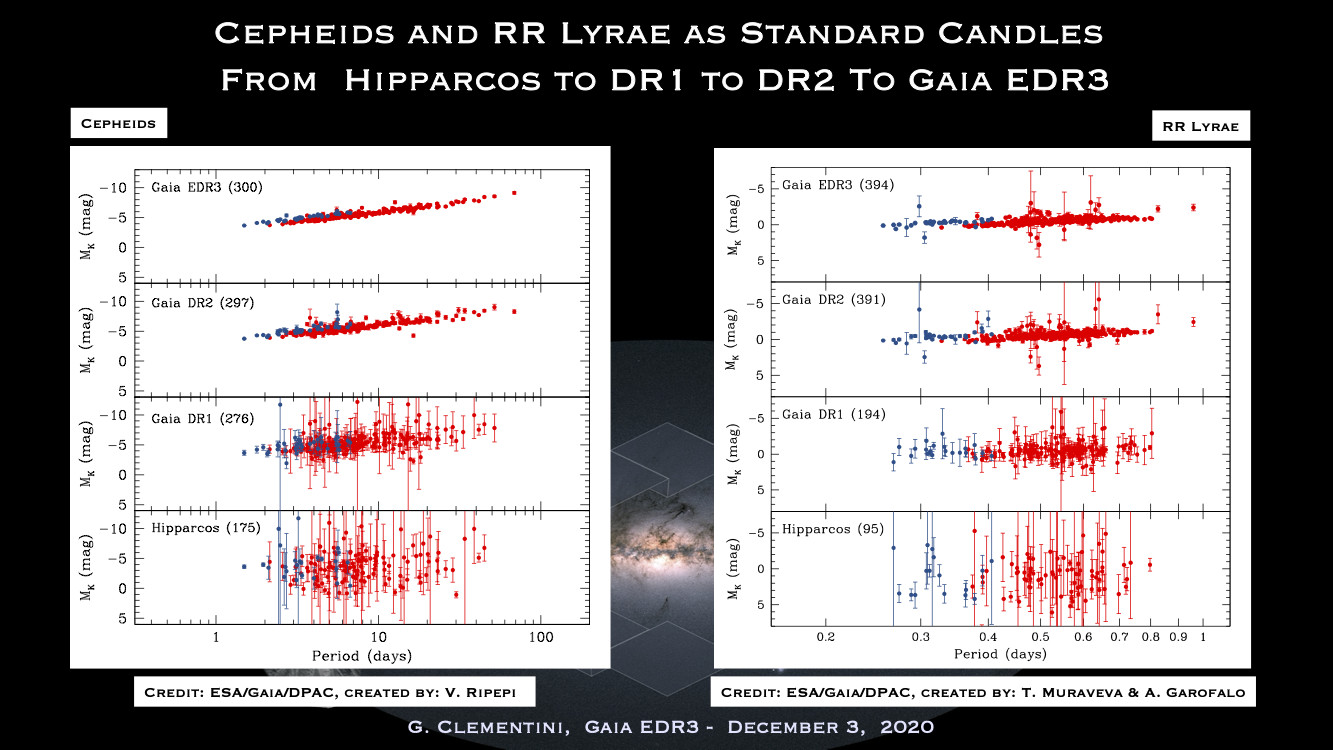
Image credit: ESA/Gaia/DPAC - CC BY-SA 3.0 IGO
These plots shown are inspired by, and are in fact an update of similar figures published in Gaia Collaboration, Clementini et al. 2017, 605, A79 (see figures 20 and 23 in that paper). On the left one sees the Period - Absolute Magnitude in the K-band (MK) relations for classical Cepheid, on the right the Period - MK relations for RR Lyrae stars is shown. In all panels red symbols are used for variables which pulsate in the fundamental pulsation mode, blue symbols show first overtone pulsators.
The 4 panels on the left show, from bottom to top, absolute magnitudes, MK , for 175 classical Cepheids with positive parallaxes from Hipparcos, 276 classical Cepheids with positive parallaxes from Gaia DR1 Tycho-Gaia astrometric solution (TGAS), 297 classical Cepheids with positive parallaxes from Gaia DR2 and, 300 classical Cepheids with positive parallaxes from Gaia EDR3.
The 4 panels on the right show, from bottom to top, absolute magnitudes, MK , for 95 RR Lyrae stars with positive parallaxes from Hipparcos, 194 RR Lyrae stars with positive parallaxes from Gaia DR1 (TGAS), 391 RR Lyrae stars with positive parallaxes from Gaia DR2 and 394 RR Lyrae stars with positive parallaxes from Gaia EDR3.
Absolute magnitudes were calculated from parallaxes by using the relation: MK = mK_0 + 5 log(w)-10, where MK is the absolute magnitude in the near-infrared K-band, mK_0 is the apparent dereddened magnitude of the star, and w is the parallax in mas. The mK apparent magnitudes and reddening values are taken from Gaia Collaboration, Clementini et al. 2017, Muraveva et al, 2018, MNRAS, 481 and references therein.
The improvement produced by the Gaia EDR3 parallaxes is impressive, particularly for Cepheids.
Acknowledgement: G. Clementini, V. Ripepi, T. Muraveva, A. Garofalo
Distances of globular clusters, from Gaia DR2 to Gaia EDR3
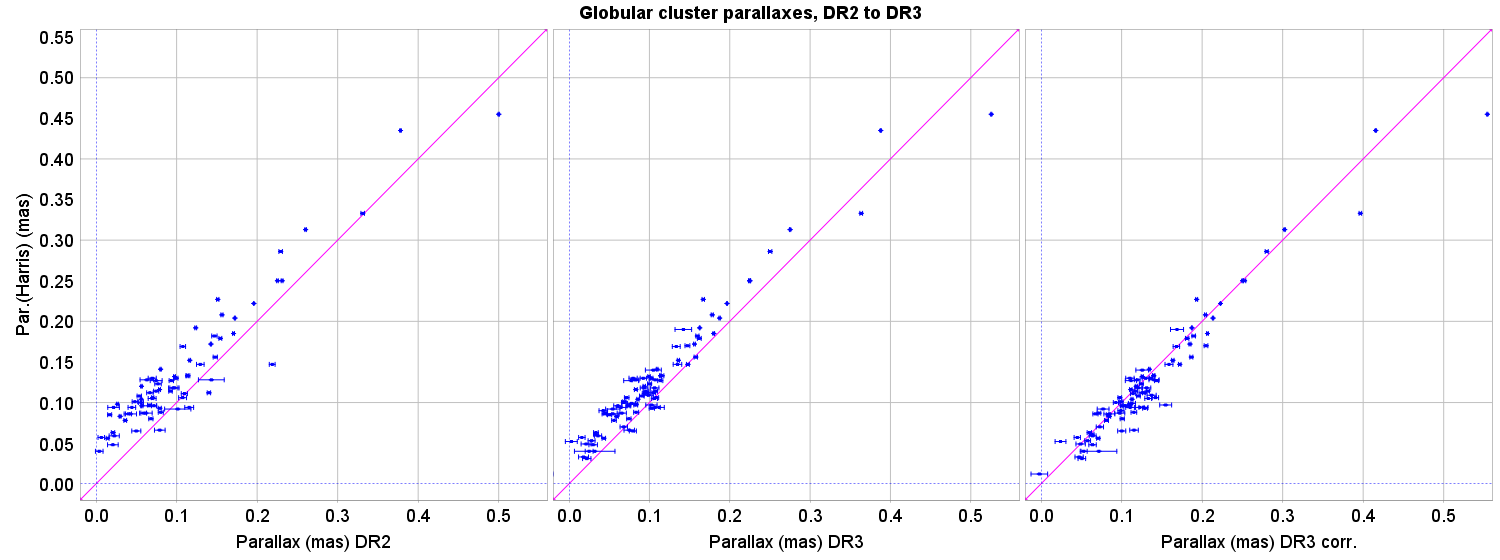
Image credit: ESA/Gaia/DPAC - CC BY-SA 3.0 IGO
The improvements by about a factor 2 in proper motion accuracy in Gaia EDR3 with respect to Gaia DR2 and similarly the improvements in parallax accuracy by about a factor 1.5 has a significant effect on the precision with which one can measure the parallaxes of globular clusters. The proper motion improvements allow for a better distinction of cluster members, in particular for the more distant ones.
The sample of globular clusters investigated was increased from 75 in Gaia DR2 to 92 in Gaia EDR3. However, the uncertainty of the parallax zero point as function of position on the sky has been for most of the clusters a much larger contributor to the uncertainty on the cluster parallax than the astrometry of the cluster itself. That uncertainty was reduced significantly in Gaia EDR3. This decrease in the variation of the parallax zeropoint shows up nicely when one compares Gaia DR2 and Gaia EDR3 based globular cluster parallaxes with ground-based, mainly photometric, distance determinations. This is shown in the figure above in the first two plots. In both cases there is a systematic offset between the ground-based and Gaia parallaxes, at about 30 muas in Gaia DR2 and 20 muas in Gaia EDR3.
Also shown in the figure, the third plot, is the same comparison, but after application of the parallax zero point corrections for Gaia EDR3 as derived by Lennart Lindegren on a wide range of, mainly very distant, sources. The systematic offset has been significantly reduced.
Finally, there is also a completely independent distant determination becoming available for globular clusters, and this will improve rapidly with the length of the time interval covered by the data. It is based on measuring the apparent contraction or expansion of the cluster as it moves away or towards us, and comparing this with the mean radial velocity of the cluster. This can be done already, with good accuracy, for one cluster, NGC 3201, which has a radial velocity of 494.6 km/s. For this cluster one can measure the contraction rate to better than 2%, giving a direct parallax measurement, one that is not affected by Gaia parallax zero point uncertainties, to an accuracy of 4.3 muas.
A comparison between the observed and expected perspective contraction is shown in the figure below as the grey line (predicted) and blue line (observed). Interestingly, this is also the way in which the parallax of the Hyades cluster used to be determined before the Hipparcos and Gaia data came available.
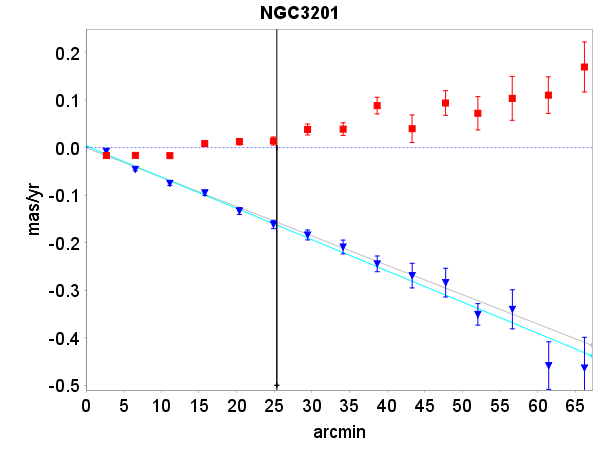
Image credit: ESA/Gaia/DPAC - CC BY-SA 3.0 IGO
The figure shows the mean transverse (top) and radial components of the proper motions for stars in the globular cluster NGC 3201. The perspective contraction of the cluster shows as a linear dependence of the radial component of the mean proper motion as a function of distance from the cluster centre.
Acknowledgement: F. van Leeuwen
The formation of the HR diagram
Gaia DR2Credit: ESA/Gaia/DPAC - CC BY-SA 3.0 IGO | Gaia EDR3Credit: ESA/Gaia/DPAC - CC BY-SA 3.0 IGO |
For Gaia EDR3 a video similar than the one created for Gaia DR2 on the formation of the Hertzsprung-Russell Diagram was made. In the Gaia DR2 video on starts at the 2D projection and then sorts by the Gaia colour (BP-RP), then by apparent G magnitude and then by absolute G magnitude. In this animation 58,000 stars were used.
In the Gaia EDR3 visualisation, one starts by showing a 3D zoom-out of 5 million stars around the Sun and then limits to a sphere of 400 light year radius displaying about 135,000 stars. The sample is then first sorted by absolute G magnitude and then by colour (GRP). We remark the paucity of stars in the red main sequence region (known as the Wielen gap). We also remark that in this Gaia EDR3 video the white dwarfs sequence is much more populated than the in the visualisation that was created for Gaia DR2.
Acknowledgements:
Video Gaia DR2: Produced by Krzysztof Nienartowicz, Laurent Eyer, Lorenzo Rimoldini and the whole CU7/DPCG Geneva and international DPAC teams.
Video Gaia EDR3: This video was created by L. Rohrbasser, K. Nienartowicz, L. Eyer.
Credit: ESA/Gaia/DPAC
Page last updated: 04 December 2020