
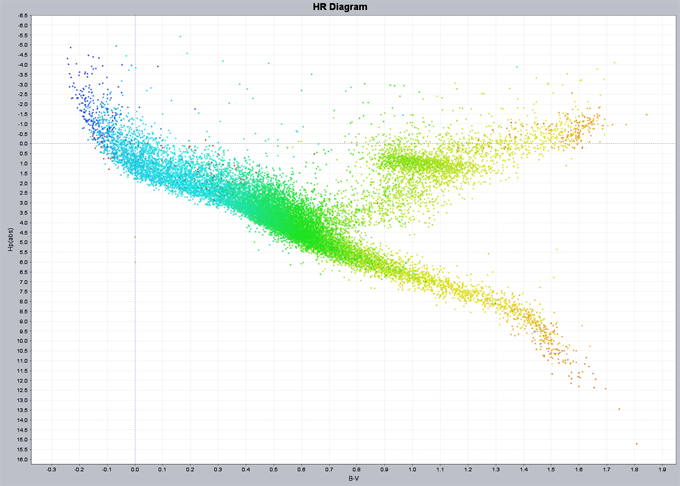
Hipparcos HR diagram. The Hertzsprung-Russell (HR) diagram for 30000 stars with parallax accuracies better than 10 per cent, as measured with the Hipparcos satellite. The stellar temperatures are represented by a colour index, B-V, which measures the slope of the stellar spectrum in the visual wavelengths. The brightness is given as the absolute magnitude in the Hipparcos photometric system, Hp(abs). These so-called absolute magnitudes refer to the brightness of the source if it were observed at a distance of 10 parsec. By putting all stars at the same distance, a Hertzsprung-Russel diagram is created, in which their relations between temperature and brightness can be observed. View larger image.
A critical element in the data reductions for both Hipparcos and Gaia is the reconstruction of the attitude, which describes the motions and pointing directions of the satellite as a function of time. A close examination of the original attitude reconstruction results for Hipparcos exposed the presence of hits and clanks, and a general discrepancy between the fitted attitude and the expected attitude behaviour as based on the equations of motion for a free-floating rigid body in space.
About 80 small hits were identified in the data. As a result of a hit there will be a discrete change in the rotation rates of the satellite. Also about 1600 clanks were noted. A clank is caused by a discrete adjustment to temperature changes within the structure of the satellite. For Hipparcos those adjustments could be traced to the attachment of one of the solar panels. A clank results in a discrete change in the pointing of the satellite. The observed range of clanks was between 20 and 120 mas. A new dynamic attitude reconstruction model was created, in which the torques acting on the satellite are modelled as continuous functions of time. Rates and pointing directions are obtained through the appropriate integrations. The model takes into account any registered hits and clanks by introducing discontinuities at the relevant times. The new modelling reduced the attitude modelling noise by a factor 5, from 3 down to 0.6 mas. The new reduction used the astrometric iterative solution also planned for the reduction of the Gaia data. The end product was a catalogue with much improved accuracies, error correlations reduced to an insignificant level, and standard errors that are directly derived from the original observations, without any artificial adjustment, and limited by photon statistics only for all but the very brightest stars. The highest parallax accuracies reached are just below 0.1 mas, which is a factor 5 better than in the original 1997 publication, and a factor 20 better than targets set for the Hipparcos mission in the 1980s. The new reduction was published in 2007.
Visit the new Hipparcos reduction page on ESA's website.
"Hipparcos, the New Reduction of the Raw Data" publication.
Accessing the Hipparcos data
An interactive tool to access and explore the Hipparcos data has been developed and is available for download. The tool is available as a compiled Java file. You can download the .jar file (4.7MB), and the data files (zip archive, 1.26GB). The only further requirement is to have Java 8 installed to run the jar file. The full user manual is available, and describes the installation and operation of the software.
The software can be used to find individual stars in the Hipparcos catalogue and inspect in detail the data for those stars. It can also be used to show Hertzsprung-Russell diagrams with various dependencies, such as spectral type, surface gravity, stellar kinematics, and to combine the Hipparcos astrometric data with ground-based photometric data to examine dependencies in colour-colour diagrams. Any data point in these diagrams can be identified with a star and linked to the detailed information for that star. Maps of the sky can be produced with constellation boundaries and identification, and many other things are possible, all described in the user manual.
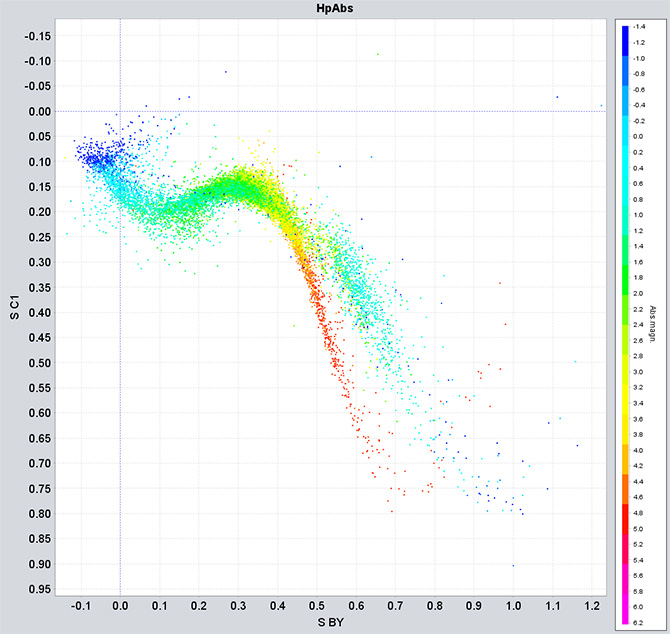
This figure shows photometric data in the Strömgren system, plotting the index C1 against the colour index (b-y). The data points are coloured according to the absolute magnitudes as determined with the Hipparcos parallax measurements, including only stars with relative parallax errors less than 10%. The red dots represent cool dwarf stars, the blue dots the much brighter and more massive stars and giants. View larger image.
Page last updated: 14 June 2022