
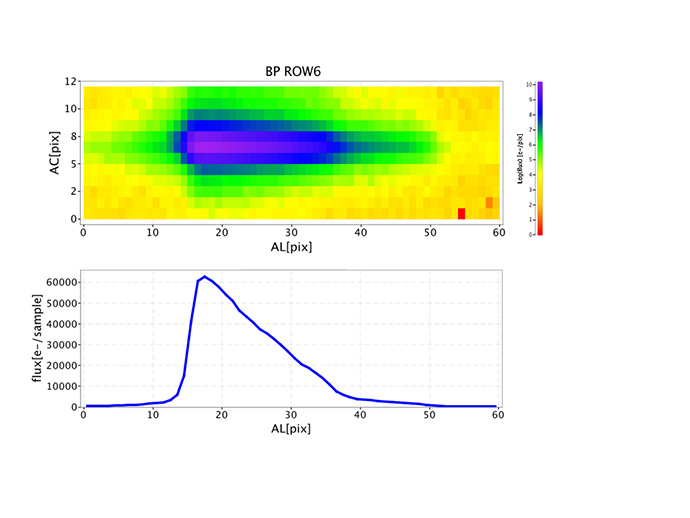
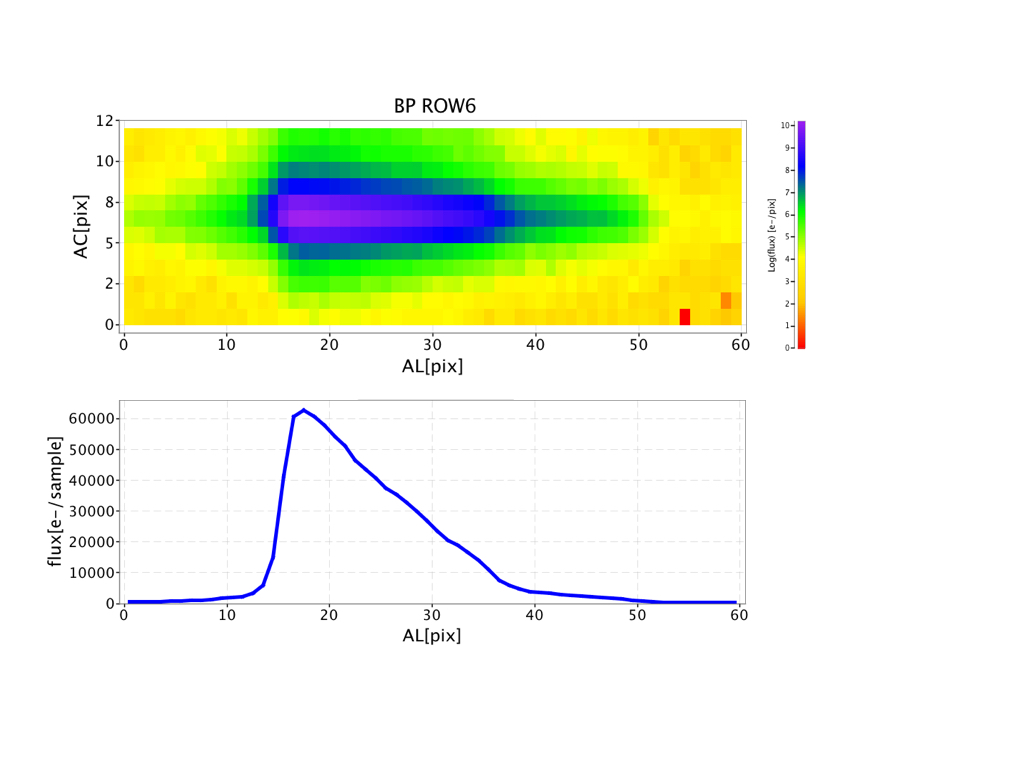
Figure 1. Gaia BP spectra. Examples of Blue Photometer (BP) spectra measured by the 6th-row CCD (Charge-Coupled Device) of the Blue Photometer (see Focal plane and observation sequence for the diagram). AC is the position, in pixels, in the direction perpendicular to the scan direction; AL is the position in the direction of the scan. View large image. Image credit: Giorgia Busso.

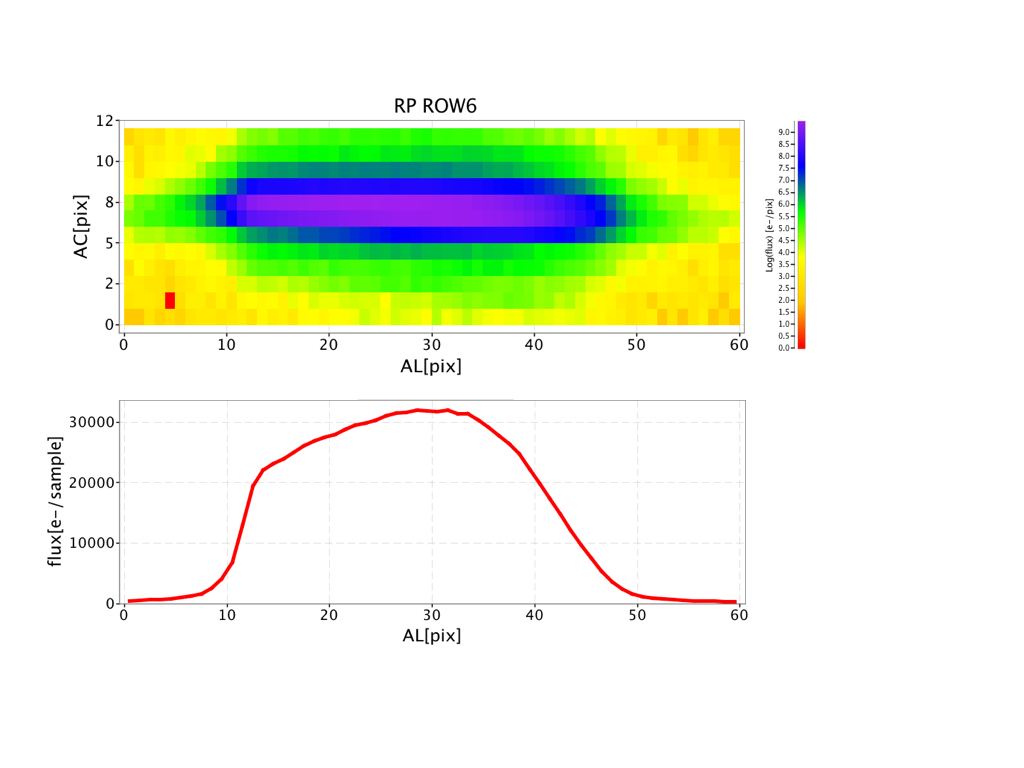
Figure 2. Gaia RP spectra. Examples of Red Photometer (RP) spectra measured by the 6th-row CCD of the Red Photometer. View large image. Image credit: Giorgia Busso.
The Blue and Red Photometers on board Gaia are the instruments that produce the low resolution spectra for (almost) every source detected in the Sky Mapper and Astrometric Field.
These photometers are actually low resolution spectrometer as the light passes through a prism which disperses it in different wavelengths. The Blue Photometer generates spectra in the bluer wavelengths (from 330 to 680 nm) and the Red Photometer in the redder ones (from 640 to 1050 nm).
Two examples of BP and RP 2D windows spectra are shown respectively in Figures 1 and 2. While the brighter stars are collected as 2D windows (top figures), most of the spectra for the fainter stars are obtained as one-dimensional profiles as the 2D windows are summed up in the direction perpendicular to the scan direction (bottom section of each figure).
The BP and RP spectra are needed for obtaining information on the astrophysical parameters of the observed objects: the integrated flux is calculated summing the flux in the window (after subtracting the sky background and contributions from other sources) and from that the colour of the star is obtained as difference between the two integrated fluxes BP-RP. The colour then gives information on the temperature of the source. Not only that, from the analysis of the spectra shape and the presence of features also other parameters can be inferred, as surface gravity and chemical composition. This knowledge, together with the positions and motions of the stars, will allow us to distinguish different stellar populations in the Milky Way.
The software that processes and analyses the BP and RP spectra is called PhotPipe and it is run at DPCI, the Data Processing Centre based at the Institute of Astronomy in Cambridge.
Page last updated: 21 June 2016