
In a Hertzsprung-Russell diagram (HRD) stars are plotted according to their colour (on the horizontal axis) and brightness (on the vertical axis) and are grouped in different regions of the diagram depending mainly on their masses, chemical composition, ages, and stages in the stellar life cycle. Information about stellar distances is fundamental to calculate the true brightness, or absolute magnitude, of stars.
Star clusters are dynamically bound groups of hundreds to many thousands of stars sharing the same formation history, and thereby being of the same age and composition. Covering stars with a wide range of masses, they provide invaluable information on stellar evolution through their HRD (see Star clusters: observing the effects of stellar evolution for more information). But for that to be extracted, distances need to be accurately known, and high-accuracy photometric data is needed. Gaia Data Release 2 has provided both for a sample of 46 galactic (or open) clusters, and 75 globular clusters.
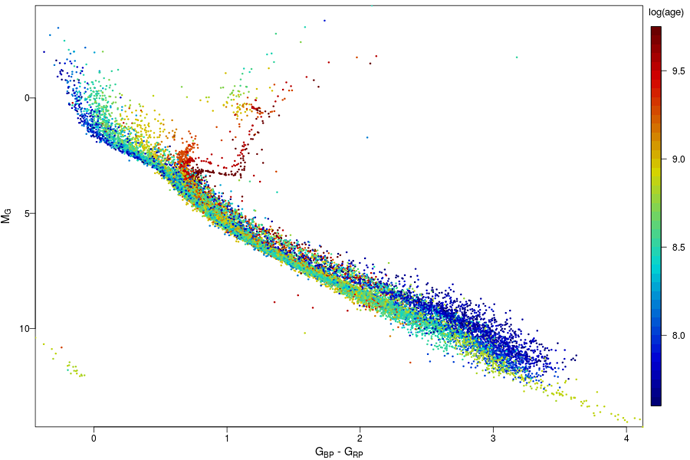
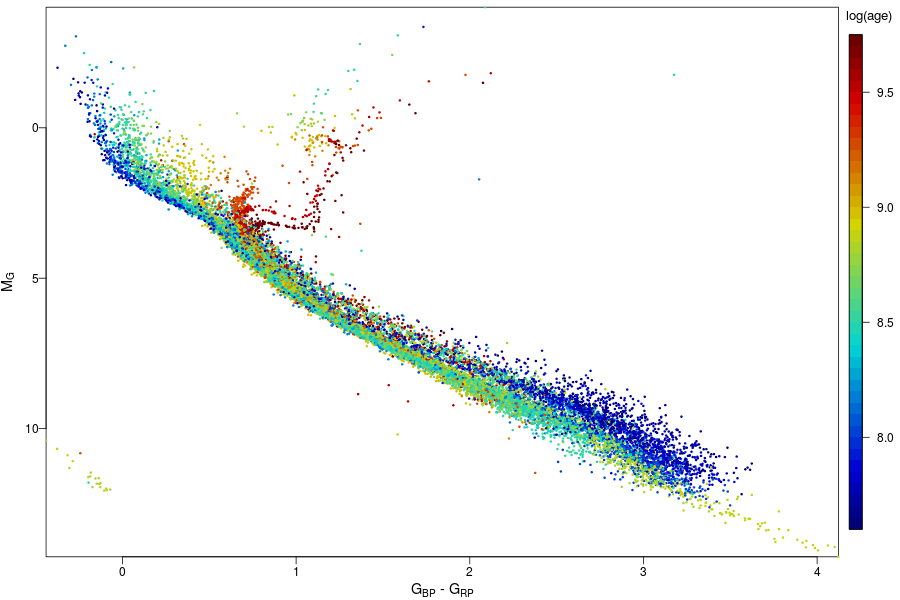
This image shows a combined HRD for 32 open clusters made with the second Gaia data release data. Colour indicates cluster age: stars that are members of younger clusters are shown in blue, stars belonging to older clusters - in red. The effects of cluster age can clearly be distinguished.
Download larger image (PNG, 139 KB).
Credits: ESA/Gaia/DPAC, Carine Babusiaux and co-authors of the paper "Gaia Data Release 2: Observational Hertzsprung-Russell diagrams".
Page last updated: 30 May 2018