
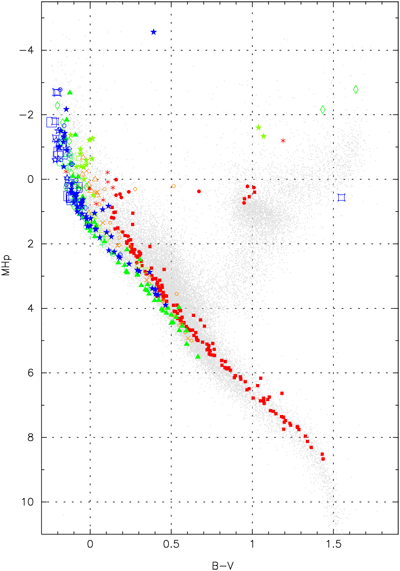
Cluster isochrones. Observed isochrones for star clusters, based on parallaxes and photometry obtained with the Hipparcos satellite. The ages of the clusters are indicated by the colours of the dots, with the youngest clusters (around 50 million years old) in blue, to the oldest (around 1 billion years old) in red. The background shows the data for 30000 stars with accurate parallaxes as obtained in the new reduction of the Hipparcos data.
Star clusters offer astronomers a very effective way of studying the effects of stellar evolution. A star cluster is group of stars that were formed at the same time and from the same cloud of gas and dust. All stars in a cluster are therefore of nearly the same age and composition. The stars in a star cluster cover a wide range of masses, typically ranging from less than 0.1 to more than 10 solar mass. The very massive stars evolve very quickly, while low mass stars evolve very slowly. As stars evolve, they will go through different phases of energy production. This reflects in the relation between the brightness of a star and its temperature. A star will typically spend most of its life “burning” hydrogen (known as the "main sequence" stage), producing helium. When hydrogen becomes depleted, a phase of helium burning starts. What happens next depends very much on the mass of the star.
When we observe stars in a particular star cluster, we observe a clear relation between the temperature and brightness. As these stars are all of the same age, we call this relation an isochrone, in this case it is an observed isochrone. We can recognize clusters of different ages by looking at the relation between brightness and temperature for the most massive stars of each cluster. For example, the most massive stars in the Hyades cluster have already evolved beyond their main sequence stage, while similar stars in the much younger Pleiades are still close to the main sequence.
Gaia is going to make a huge impact on such studies. It will determine accurate distances of a few hundred star clusters in our galaxy. For those clusters it will provide complete and accurate lists of stars that are cluster members. The photometry provided by Gaia will allow us to translate this information into a set of observed isochrones. A comparison of observed isochrones with similar isochrones as obtained through modelling will enable us to adjust the models and learn more about stellar evolution, stellar structure and stellar atmospheres.
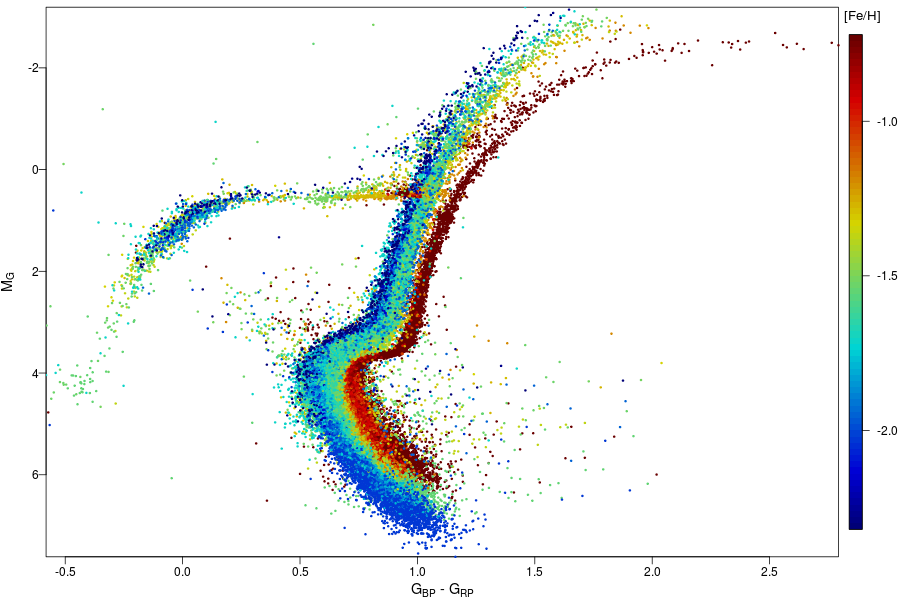
Gaia Data Release 2 combined cluster H-R diagrams

Combined Hertzprung-Russell diagrams of star clusters made with Gaia Data Release 2 data. In the above two diagrams Gaia's colour is plotted horizontally, bluest at the left. Star clusters are dynamically bound groups of hundreds to many thousands of stars sharing the same formation history, and thereby being of the same age and chemical composition. Covering stars with a wide range of masses, they provide invaluable information on stellar evolution through their Hertzsprung-Russell diagram. But for that to be extracted, distances need to be accurately known, and high-accuracy photometric data is needed. Gaia has provided both for a sample of 46 young galactic (or open) clusters, and 75 old globular clusters. The first image (left) shows the combined HRD for 32 open clusters, where the effects of cluster age can clearly be distinguished. Blue is younger, red is older. The second image (right) shows the combined HRD for 14 globular clusters. Here the differences are primarily in chemical composition, and the way this affects stellar evolution. Red contains more heavy elements, blue fewer. (Large versions of images: open clusters HRD, globular clusters HRD.) These images are from one of the science demonstration papers that accompany the second Gaia data release, Gaia Collaboration, Babusiaux, C., van Leeuwen, F., Barstow, M.A. et al. 2018a, A&A (special issue for Gaia DR2). Credit: ESA/Gaia/DPAC/Babusiaux, C., van Leeuwen, F., Barstow, M.A.et al.
Page last updated: 02 May 2018